
 From 1990 to 2013, Canada’s greenhouse gas (GHG) emissions increased by about 18.5%.* (1)
Most of this increase (88%) came from the increasing emissions from oil & gas production, refining, and mining industries, (39%) and from increases in transportation emissions (49%). (1)
On this page, we look at the biggest contributors to the change were from
- Oil industries – Emissions from oil & gas production and mining increased by 39% from 1990 to 2013.
- Much of this is due to expansion of the tar sands.
- Transportation – Emissions increased by 49.6%.
- Much of this was due to a shift to and increased use of SUVs and vans, as well as more use of semi-trailer trucks to move goods.
- Electricity and heat generation – Emissions increased by 8%. Emissions in this sector peaked in 2004 and have been in a general decline. However, emissions have crept up again in 2012 and 2013.
Oil industries
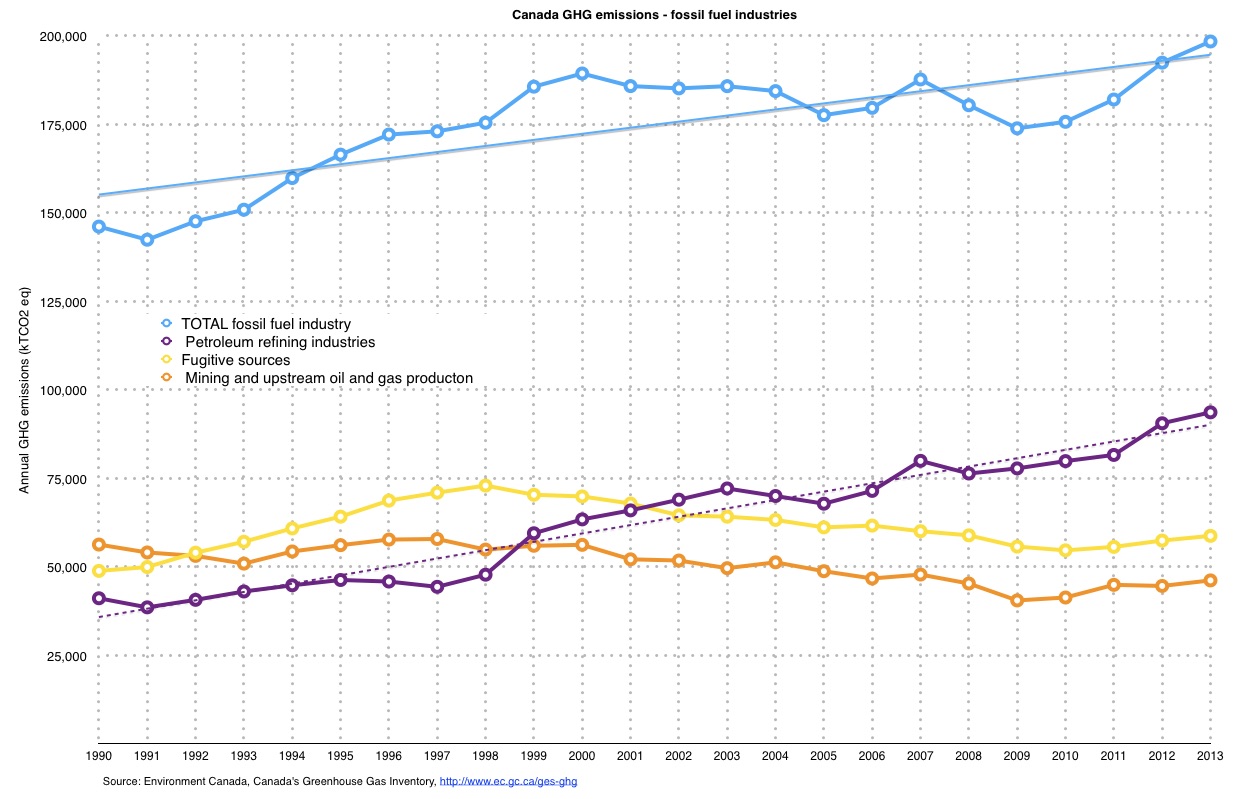
Figure 1: Canada GHG emissions trend – fossil fuel industries 1990 – 2013
In 2013, emissions from the fossil fuel industry represented 27% of Canada’s total emissions.
Figure 1 shows that this was a 35.8% increase from 1990. Petroleum refining industries’ emissions grew by 128% in this period.
A major contributor to the increase in Canada’s GHG emissions has been expansion of the tar sands (AKA oil sands or bitumen and synthetic crude oil). Most of this production is for export. (1)
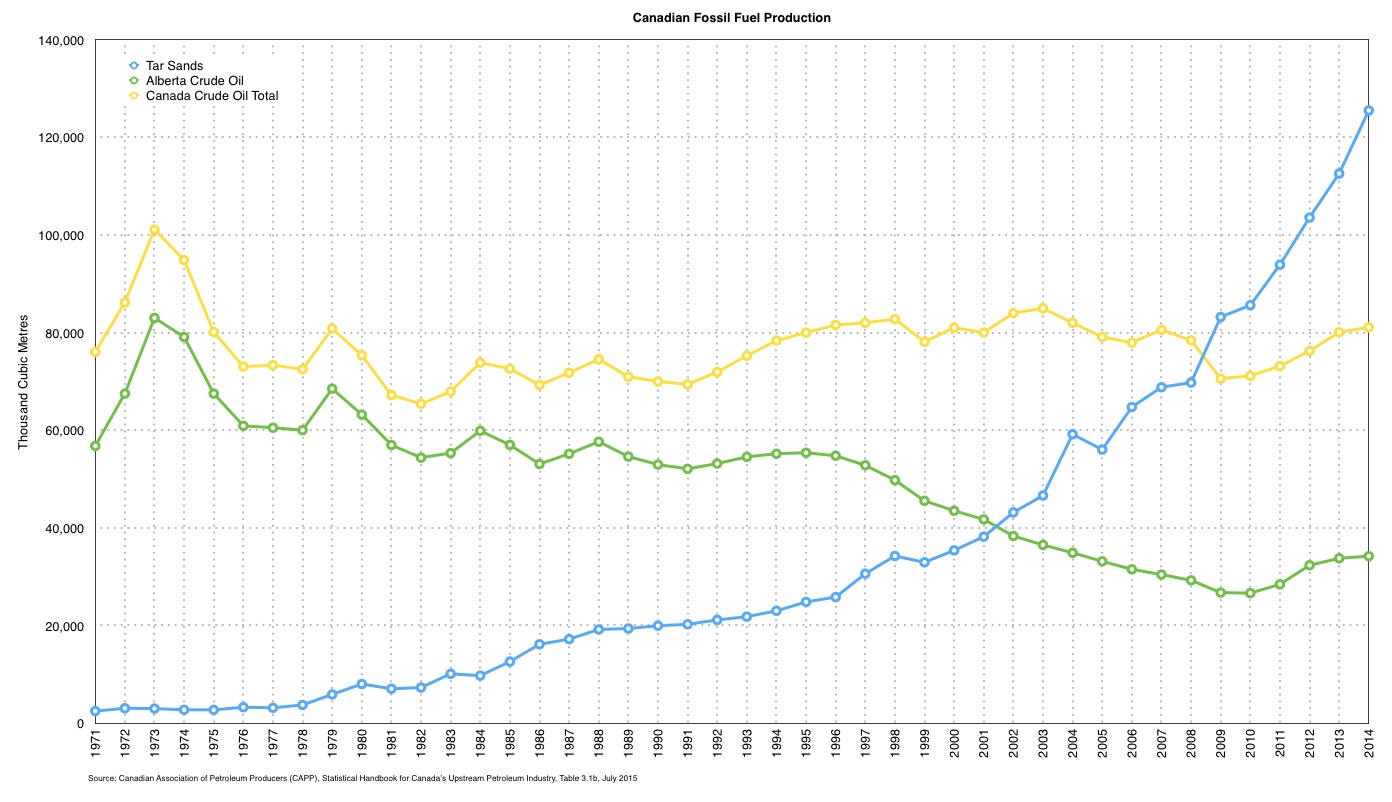
Figure 2: Canadian Fossil Fuel Production trend
Figure 2 shows that bitumen and synthetic oil production from the tar sands increased more than 6 fold (629%) from 1990 to 2013.
Canada’s production of energy from the tar sands surpassed conventional oil production in 2009. (2)
Transportation
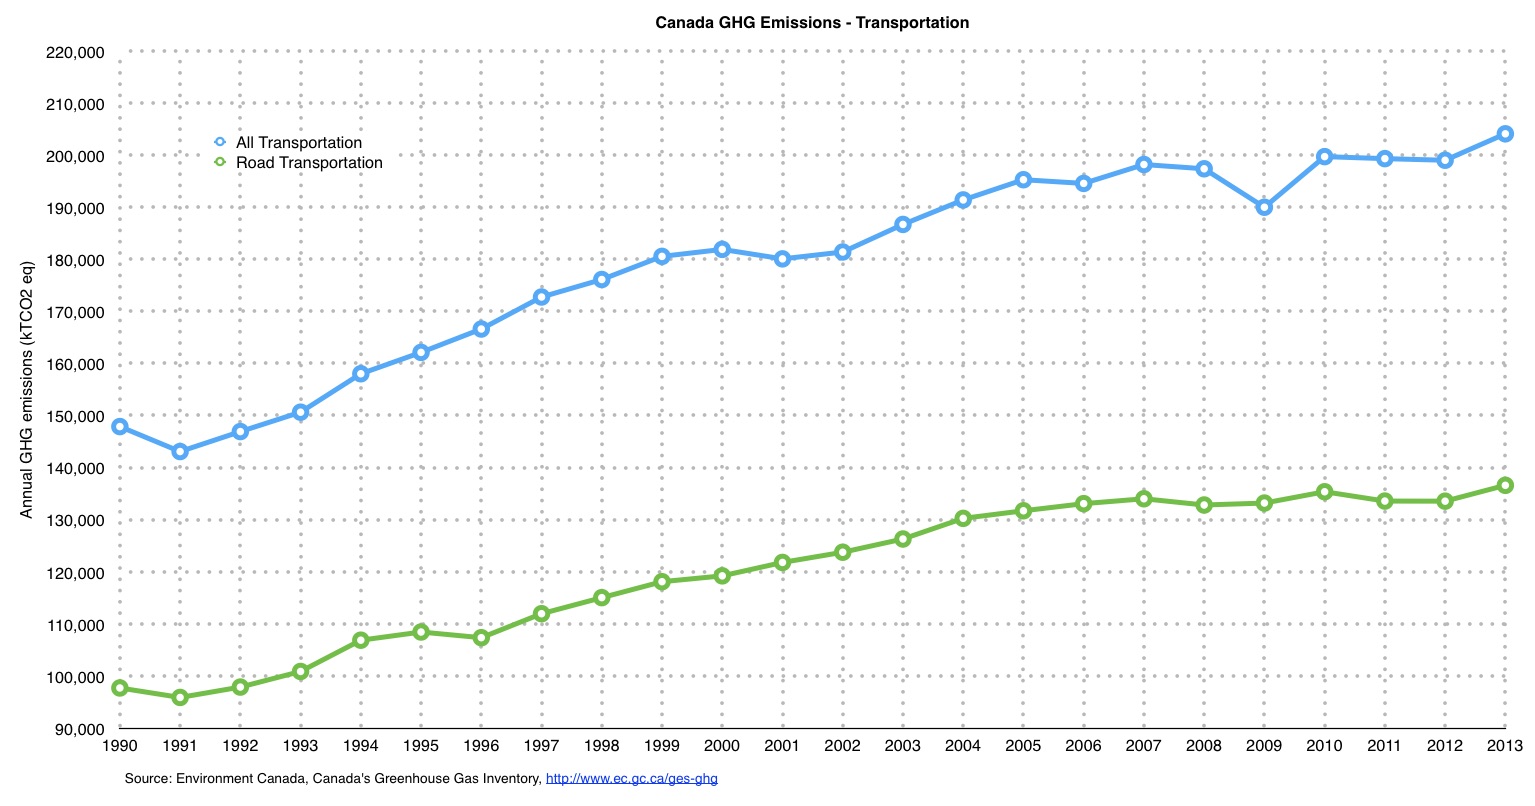
Figure 3: Canada GHG emissions transportation – 1990-2013
Figure 3 shows the trend in Canada’s GHG emissions from transportation.
Cars to SUVs
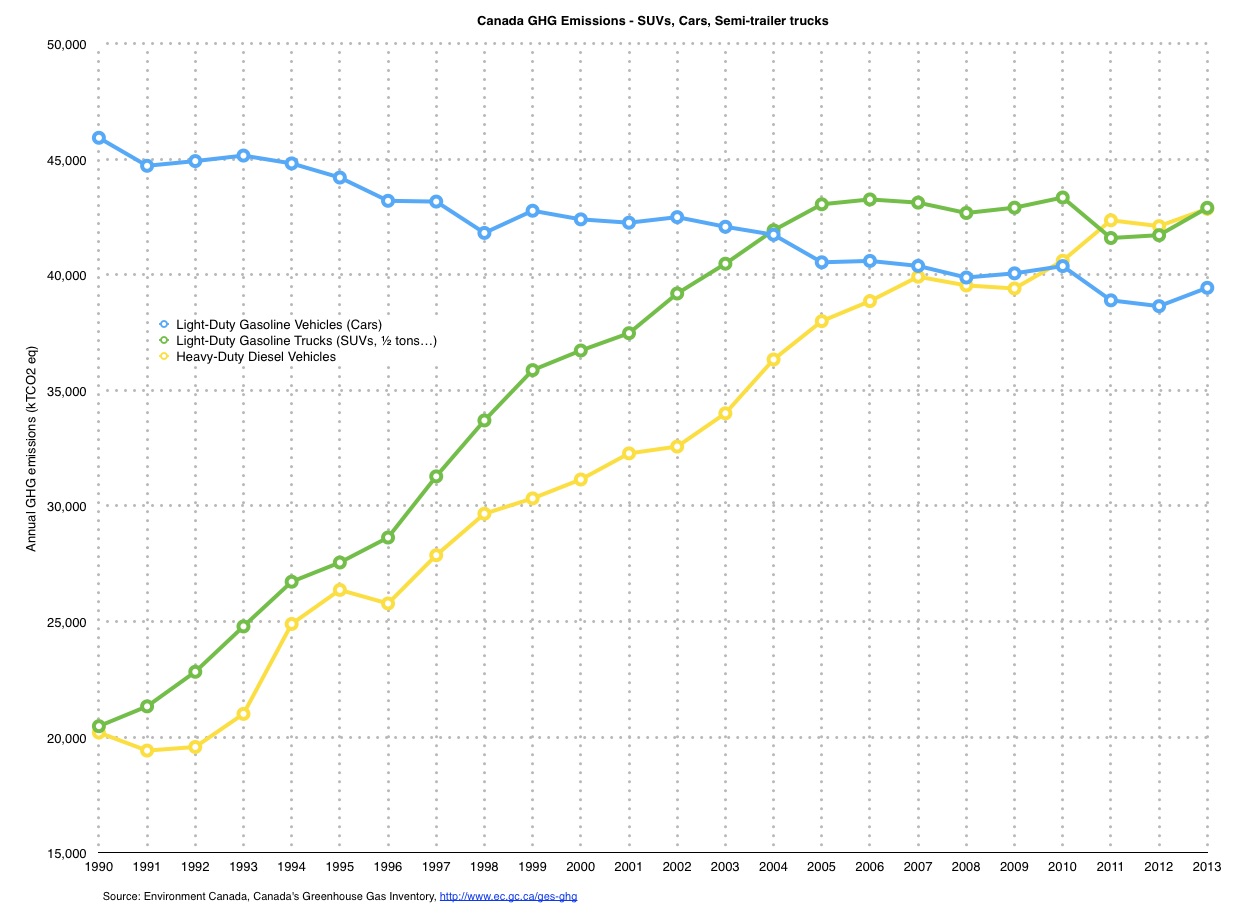
Figure 4: Canada GHG emissions – 1990-2013 transportation SUVs, cars, trucks
Transport accounted for 28% of Canada’s emissions in 2013. From 1990 to 2013, these emissions grew by 40%.
Since 1990, there has been a significant shift in the vehicle types used for passenger transport: emissions from light-duty gasoline trucks (SUVs, pickups, vans) has risen by 108%, whereas emissions from cars decreased by 14%.
Figure 4 looks at emissions from SUVs, cars, and semi-trailer trucks.
Semi-trailer trucks
Figure 4 also shows that from 1990 to 2013, there was a 112% rise in emissions from heavy-duty diesel transport.
During this period there has been a rising freight intensity of the economy. In other words, more freight transport per unit of gross domestic product (GDP). This comes about from rising trade within and between provinces and increasing international trade.
Since 1990, there has been a significant rise in the use of heavy-duty trucks for freight transport relative to rail, marine, and air. Moving freight by truck is one of the most emission-intensive ways of moving goods.
Electricity and heat
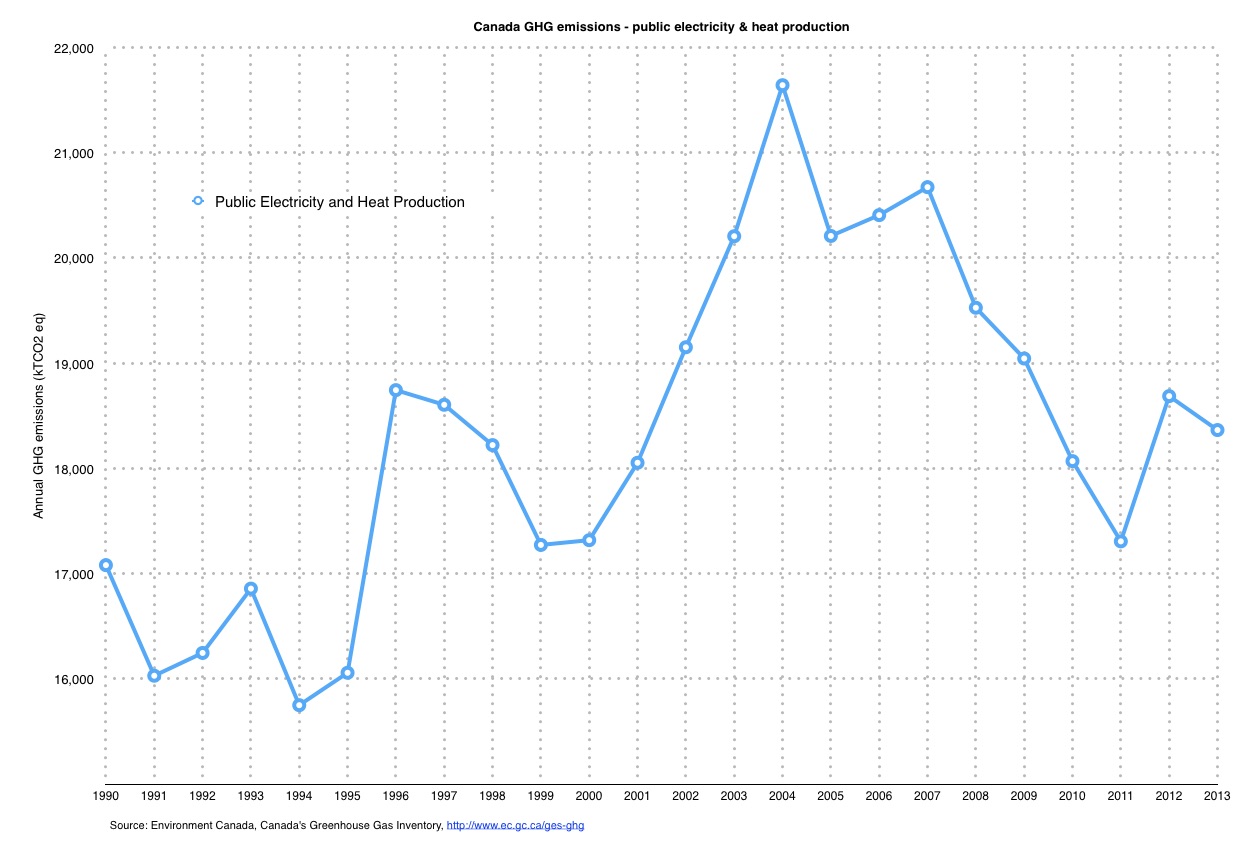
Figure 5: Canada GHG emissions electricity & public heat – 1990-2013
Figure 5 shows GHG emissions due to public electricity and heat production from 1990 to 2013.
After a peak in 2004, there has been a general decline in Canada’s total emissions from this sector.
This overall decline has largely been driven by fuel shifting:
- A switch from coal to natural gas to generate electricity
- Encouraged small-scale renewable energy sources through employment of a Feed-In Tariff (FIT)
Ontario has been responsible for much of this reduction.
A key reason that Manitoba’s GHG emissions are comparatively low is primarily because virtually all of our electricity comes for hydroelectric generation.
Electricity generation
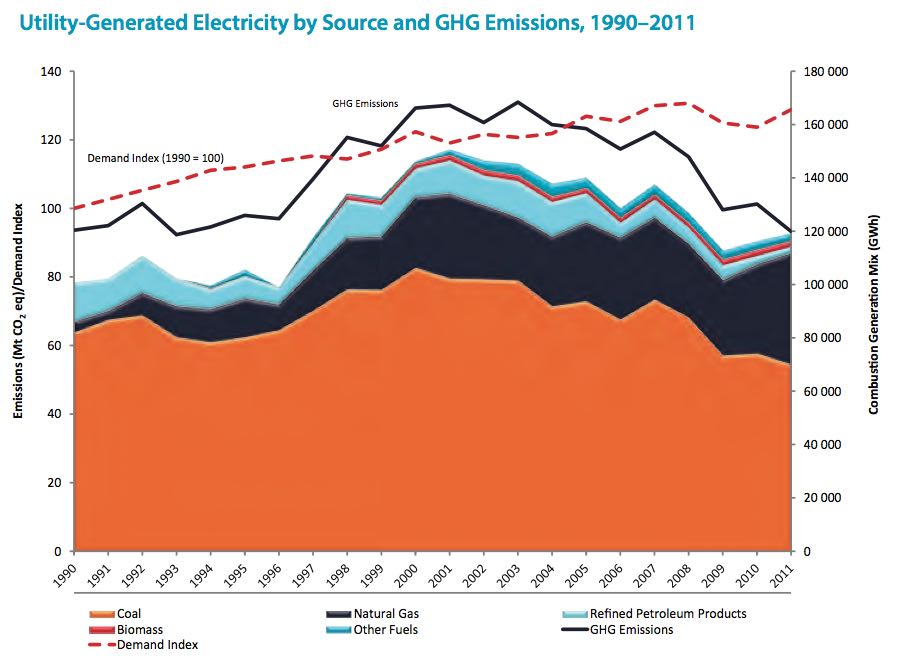
Figure 6: Canada Electrical production by source – 1990-2011
Figure 6 shows how the mix of electrical generation changed across the country between 1990 and 2011.
GHG emissions from electricity generation grew by 37% during this period. Emissions peaked in 2003. They then decreased by 29% over the next eight years.
Much of this decrease has been due to a shift away from coal and oil as a source of energy to heat the electrical generating boilers and turbines. The replacement has been natural gas. Natural gas produces less GHG per unit of power than do coal or oil.
Some of the decrease after 2002 was due to the return to service of a number of nuclear plants. This was part of Ontario’s commitment to reduced coal-fired electricity generation.
The amount of electicity generated in 2011 was 31% higher than in 1990. However, this did not result in a corresponding increase in emissions due to GHG reductions through fuel shifting and increases in efficiency.
* (726,051 – 612,745)/612,745