 Here we look at the way emissions have changed across the country from 1990 to 2013.
Different regions of the country contribute different amounts to the total greenhouse gas (GHG) emissions “pie”.
During this period, Canada’s absolute GHG emissions increased by 18%. (1) So, the pie got bigger.
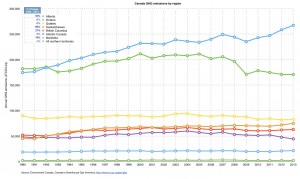
Figure 1 shows the trends. These were the main contributors:
- Alberta’s absolute emissions grew by 53%
- Saskatchewan’s emissions grew by 66%
- BC’s emissions grew by 21%
- Manitoba’s emissions grew by 14%
Ontario, Quebec, the Atlantic provinces, and the territories‘ emissions shrank during this period.
The biggest reason for the emissions growth in Alberta and Saskatchewan was from expanded fossil fuel industries.
For a PDF file of this chart with data, click here: Canada GHG emissions – 1990-2013 provinces data
Proportional contribution
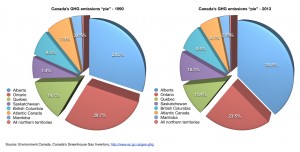
Also, the proportional contribution from each province changed from 1990 to 2013:
- Alberta’s contribution to Canada’s GHG emissions “pie” grew from 28% in 1990 to 37% in 2013.
- Saskatchewan’s contribution also grew from 7% to 10%.
Figure 2 and the table below shows the proportionate contribution from different regions to Canada’s GHG emissions “pie”. (1)
During the 1990 to 2013 period, these proportional changes occurred:
| % Change 1990 to 2013 | % of total 1990 | % of total 2013 | Diff. | |
|---|---|---|---|---|
| CANADA total | 18.5% | |||
| Alberta | 53.0% | 28.5% | 36,8% | 8.3% |
| Ontario | -6.2% | 29.7% | 23.5% | -6.2% |
| Quebec | -8.0% | 14.7% | 11.4% | -3.3% |
| Saskatchewan | 66.0% | 7.4% | 10.3% | 2.9% |
| BC | 20.9% | 8.5% | 8.6% | 0.2% |
| Atlantic prov. | -8.2% | 7.9% | 6.1% | -1.8% |
| Manitoba | 14.4% | 3.0% | 2.9% | -0.1% |
| Territories | -6.8% | 0.4% | 0.3% | -0.1% |
NOTE: Atlantic provinces include the combined emissions from the provinces of Newfloundland & Labrador, Nova Scotia, PEI, and New Brunswick.


