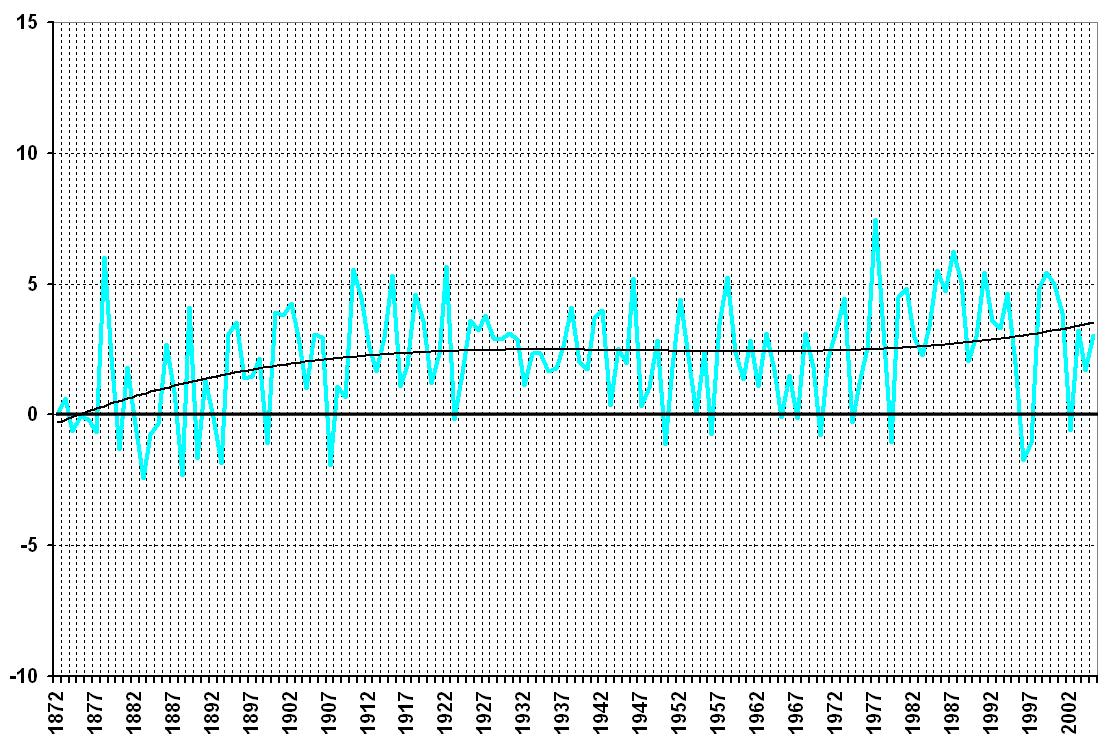
The charts below show how average temperatures have changed in Winnipeg in each season from 1872 to 2005. (1) Each point on each chart shows the average (mean) temperature (ºC) value for the same three-month period of each year:
Spring (Mar-May)
Springtime in Winnipeg has generally been warmer than it was in the late 1800s.
(Notice the dip in 1997, the year of the “Flood of the Century”)
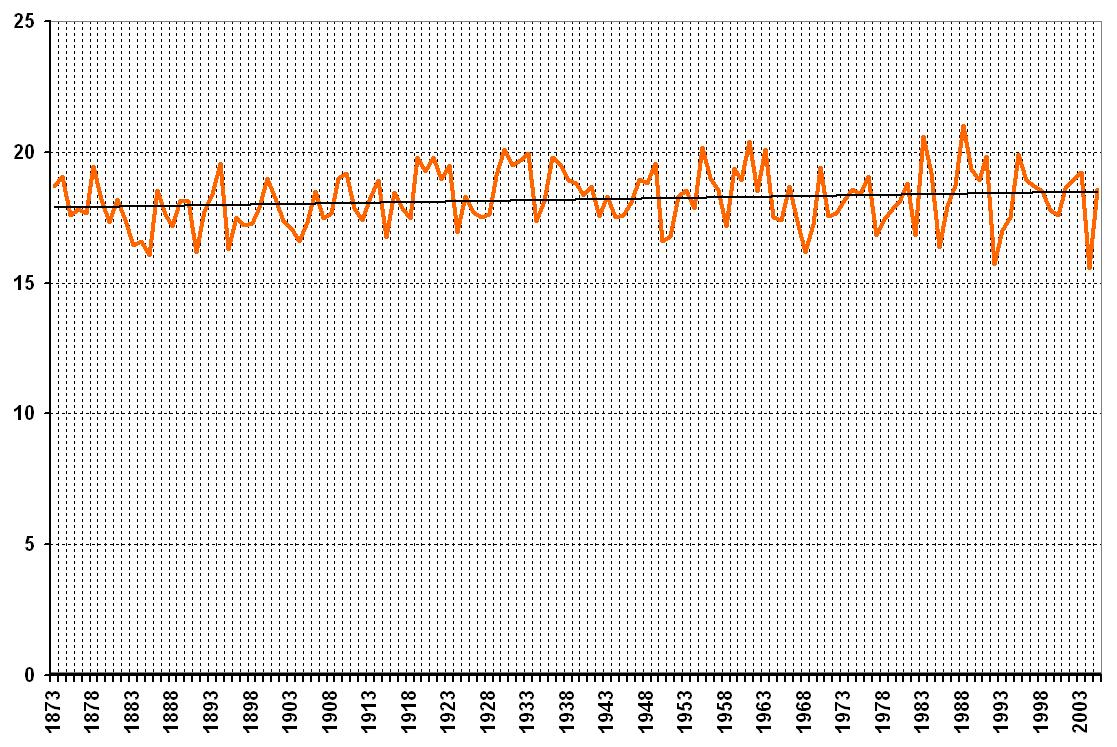
Summer (Jun-Aug)
Our summers are a little warmer but really haven’t changed much.
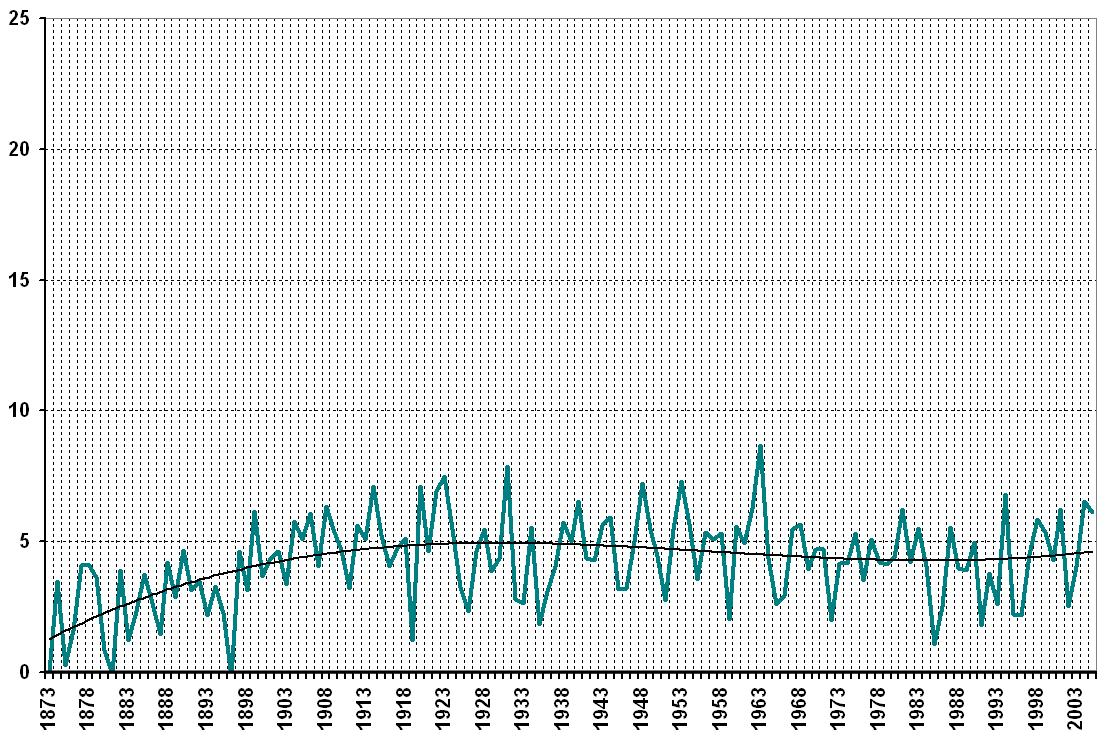
Fall (Sep-Nov)
Like spring, our autumn temperatures have gotten warmer.
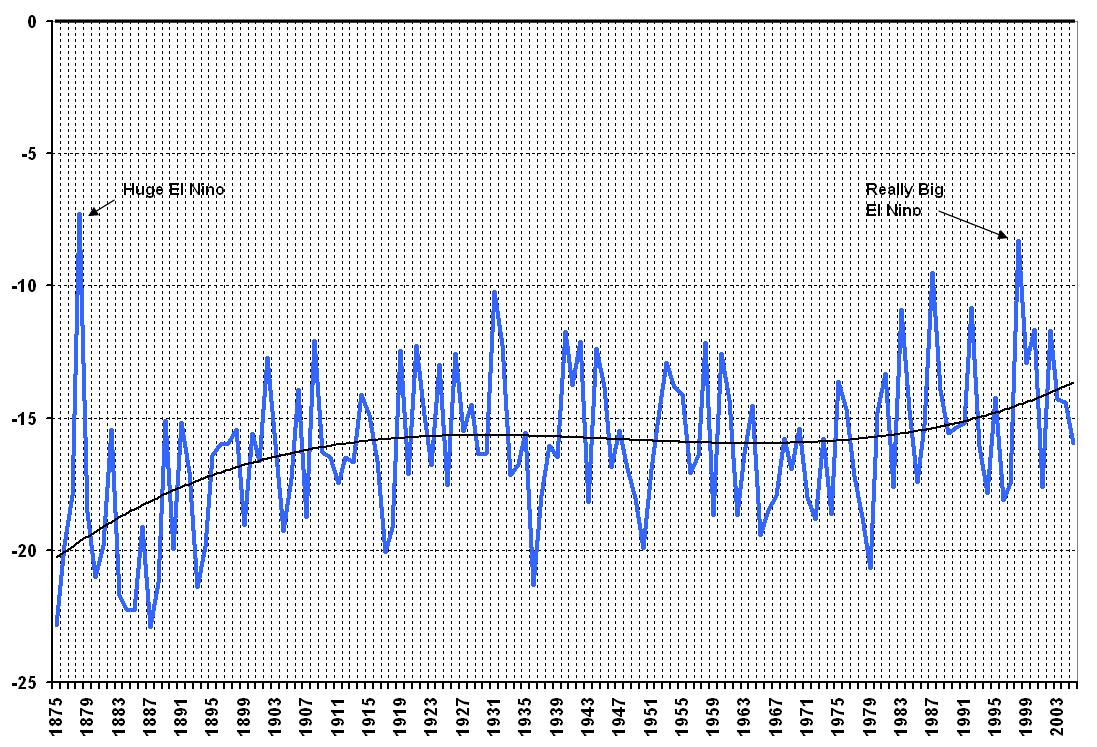
Winter
Our winters are where the real disturbances appear. The trendline shows about a 5°C increase in this period.
Note: 1877-78 and 1997-98 were strong El Niño years.
Global dimming
In the charts for three of the four seasons there is a period of warming, followed by a period of slight cooling and then more warming.
Scientists believe the cooling period was largely due to other pollution called “aerosols”, such as sulphur dioxide, that shaded the earth. This effect is most evident in the graph for winter.
Acid rain
Smog and acid rain in the 1970s were mostly caused by nitrogen oxides and sulphur dioxide from cars and coal-fired power plants. These caused global dimming.
After laws were enacted required catalytic converters on cars and scrubbers on coal plants, the clouds of pollution has reduced and the earth has gone back to warming up again.