
Figure 1: Manitoba GHG emissions – 1990-2022 – Transportation
In 2022, transportation accounted for the largest portion (about 37%) of Manitoba’s greenhouse gas (GHG) emissions (1).
- This includes the fuel used as we drive ourselves around and the fuel used to transport goods we buy.
- It does not include most of our air travel. Only air travel within the province is included in the inventory.
The figures on this page show how Manitoba’s GHG emissions from transportation have changed from 1990 to 2022.
To download a PDF file with the data, click here: Manitoba_GHG_trend_chart_1990-2022_transportation.pdf (137 KB)
Figure 1 shows that from 1990 to 2022, GHG emissions from road transportation increased by 24.8%. (1) (Note a slight drop in 2020 due to COVID travel restrictions.)
During this time, two key shifts occurred:
Cars to SUVs
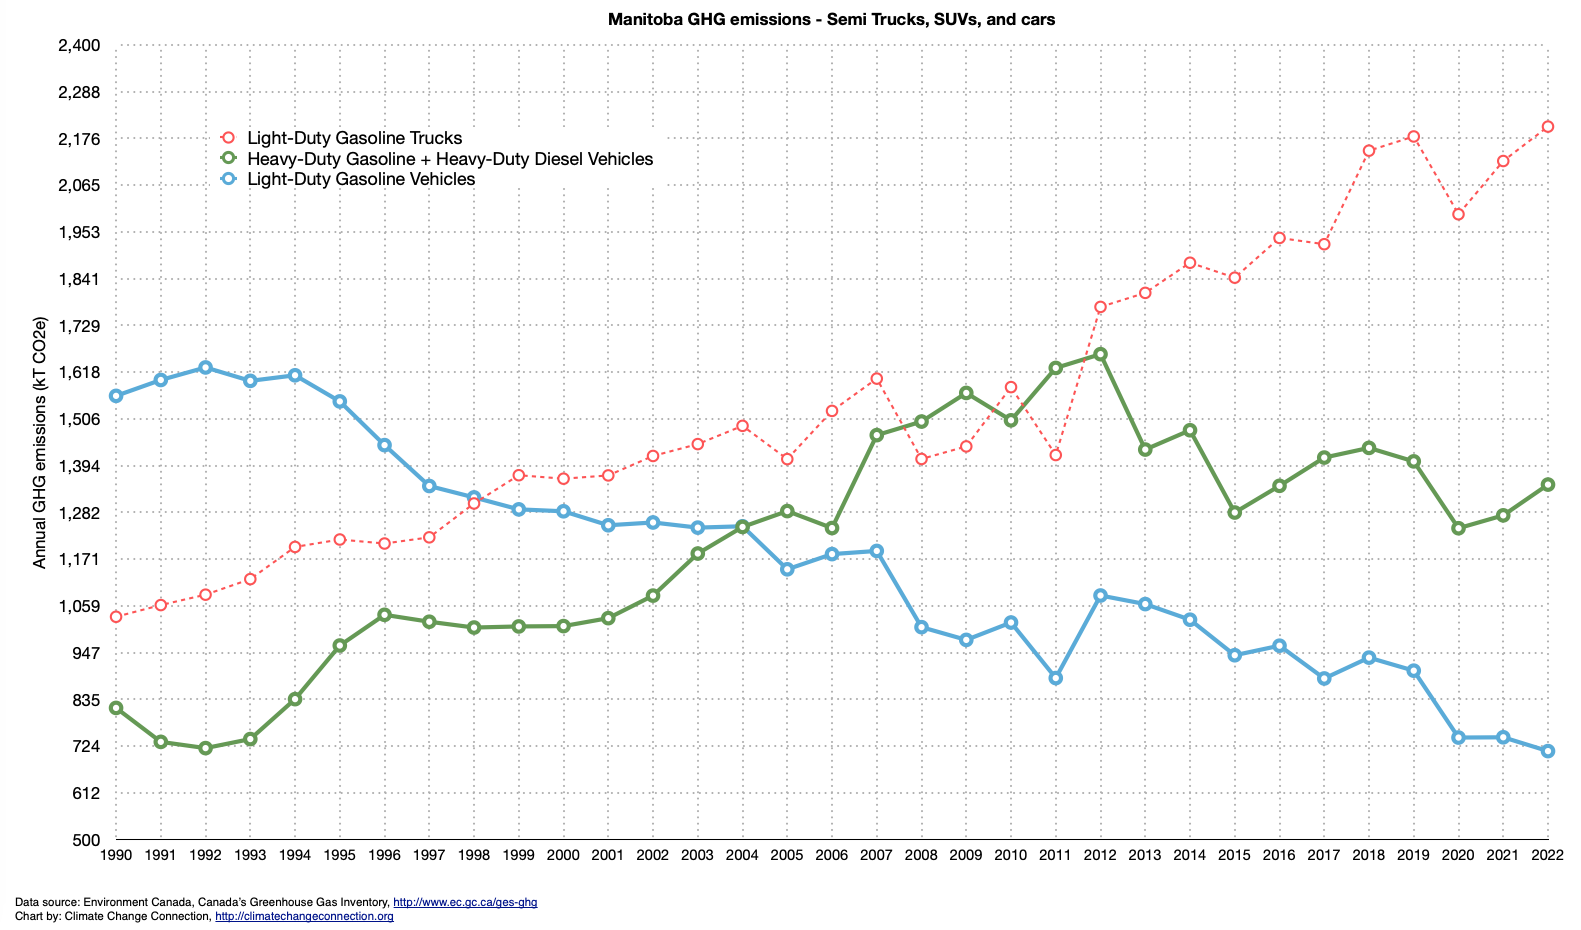
Figure 2: Manitoba GHG emissions – 1990-2022 – Cars to SUVs
Figure 2: From 1990 to 2021 there has been a shift from cars to SUVs:
- 54.4% decrease in gasoline car use (i.e. Light-Duty Gasoline Vehicles)
- 113.5% increase in van, SUV, & half-ton use (i.e. Light-Duty Gasoline Trucks).
This means the emissions from van, SUV, & half-ton vehicles in 2022 were more than twice what they were in 1990 while emissions from cars decreased by over half.
Increase in semi-trailer trucks
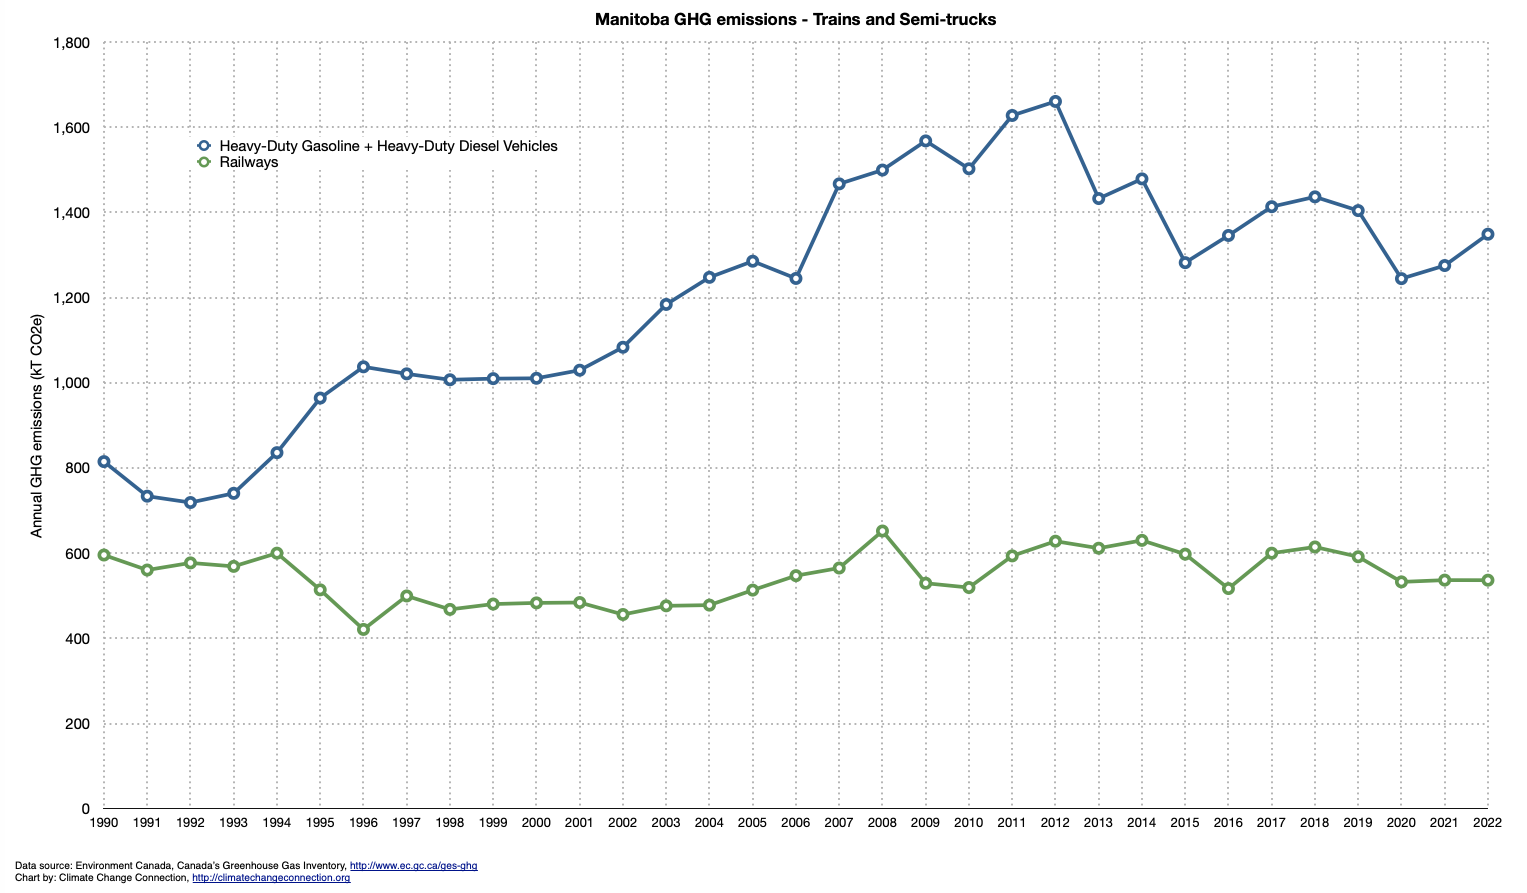
Figure 3: Manitoba GHG emissions – 1990-2022 – Trucks & Trains
Figure 3: There has been a dramatic increase in the use of semi-trailer trucks (i.e. Heavy-Duty Diesel + Heavy-Duty Gasoline Vehicles) to transport goods. Emissions in 2022 were 65.5% higher than they were in 1990.
From 1990 to 2012, emissions more than doubled. However, from 2012 to 2022, there has been a 18.7% decrease in emissions from heavy-duty trucks.