In this section, you will find data that looks at Canada’s greenhouse gas (GHG) emissions trends in two ways
![]() Click a topic to jump to a page with details.
Click a topic to jump to a page with details.
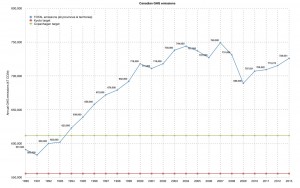
From 1990 to 2013, Canada’s GHG emissions increased by about 18%. (1)
This puts us
- 26% above what was our Kyoto target. (We were supposed to reach this target by 2012)
- 17% above our Copenhagen target. (We are supposed to reach this target by 2020)
Source data
Click this link to download Environment Canada GHG emissions data in Excel format for each province and territory (500 KB). These tables show the amount and source of greenhouse gas emissions in Canada and all provinces each year from 1990 to 2013.
Canada’s submission to the UNFCCC
The actual submission made by Canada to the United Nations Framework Convention on Climate Change (UNFCCC) is published on the UNFCCC website.
NOTE: All data are in CO2 equivalent kilotonnes per year. (1 kilotonne = 1000 tonnes = 1 million kilograms)


