
 On this page, we look at global greenhouse gas (GHG) emissions in two ways:
Click a link in the list above to jump to that topic on this page.
By source
Figure 1 shows an estimate of the carbon emissions from the burning of various fossil fuels and from cement production from 1751 to 2007. (1)

Figure 1: Global carbon emissions by fuel source – 1751-2007
There are a few things worth noting about the data:
- The 2007 global fossil-fuel carbon emission estimate is an all-time high
- The carbon emission rate in 2007 is twice the 1970 rate
- In 2006 the amount emitted from coal burning (solid fuel) surpassed the rate for gasoline (liquid fuel)
- The 2007 rate is 26% higher than 10 years before (1997)
- Cement production has been a growing contributor to global carbon emissions
These data include emissions from cement production. On average, the production of 1 tonne of cement generates 0.81 tonnes of CO2 or 0.22 tonnes of carbon. (2) This is due to the chemical process itself and the heat required for the chemical reaction and drying. Cement makes up about 15% of concrete.
NOTE: This figure shows carbon emissions, not CO2. The atomic weight of carbon is 12 and oxygen is 16. Therefore, the atomic weight of carbon dioxide is 44. Based on that ratio, and assuming complete combustion, 1 kilo of carbon combines with 2.667 kilos of oxygen to produce 3.667 kilos of carbon dioxide. (3)
By country
Here we look at changes in greenhouse gas (GHG) emissions from around the world by country in two ways:
- change in absolute amount
- change in percentage
Change in absolute amount of GHG
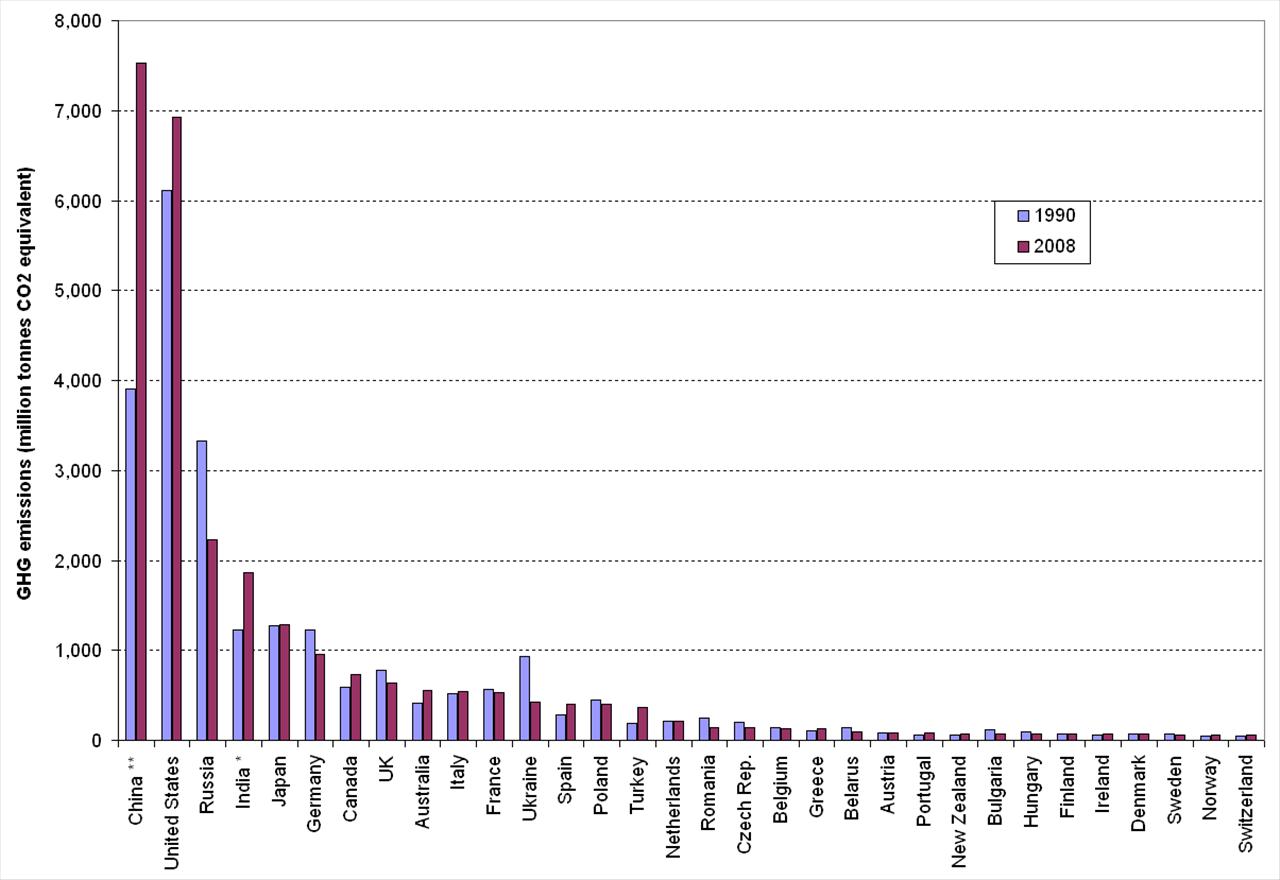
Figure 2: Global emissions by country – 1990 vs 2008
Figure 2 shows the net change in greenhouse gas (GHG) emissions for the top 30 Annex I emitting countries that report to the United Nations Framework Convention on Climate Change (UNFCCC) from 1990 to 2008 (4)
The figure also includes estimates for China and India. Neither of these are Annex I countries; they are not required to report their emissions to the UNFCCC. Also, because of data availability, estimates for China and India are for different years that the other countries:
The economies of both China and India expanded significantly over this period.
Percentage change
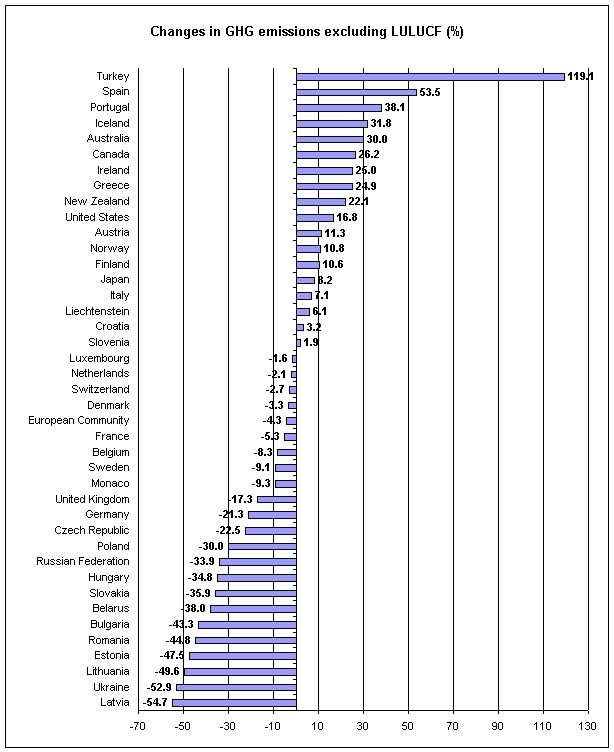
Figure 3: Global GHG excluding lulucf – 1990-2007
Figure 3 shows the percentage change in GHG emissions for the Annex I countries that report to the United Nations Framework Convention on Climate Change (UNFCCC) from 1990 to 2007 (4)
Note that:
- Canada had the sixth largest % growth in GHG over this period of countries reporting
- The graph does not include China or India
- Many of the countries that showed declines are Eastern European countries whose economies shrank significantly after the collapse of the Soviet Union